With the role Admin or Trainer, the menu item Trainer Dashboard appears in the Admin Dashboard.
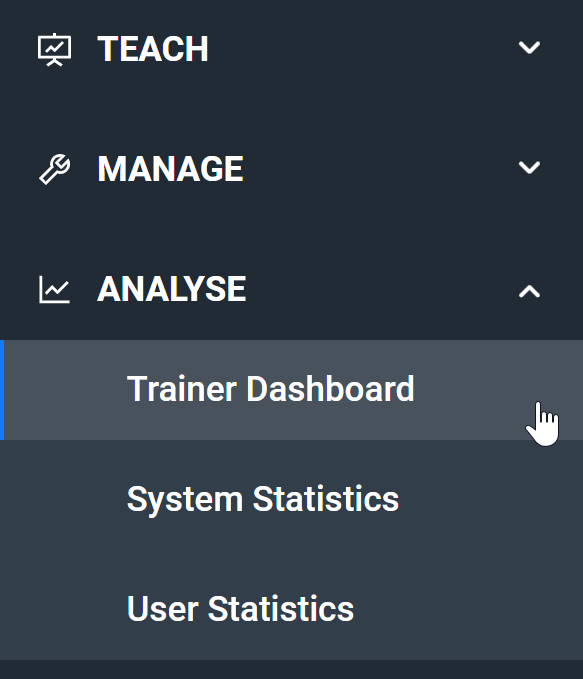
In the Trainer Dashboard you can see the progress of all groups and users that you have also assigned or can see in the Admin Dashboard.
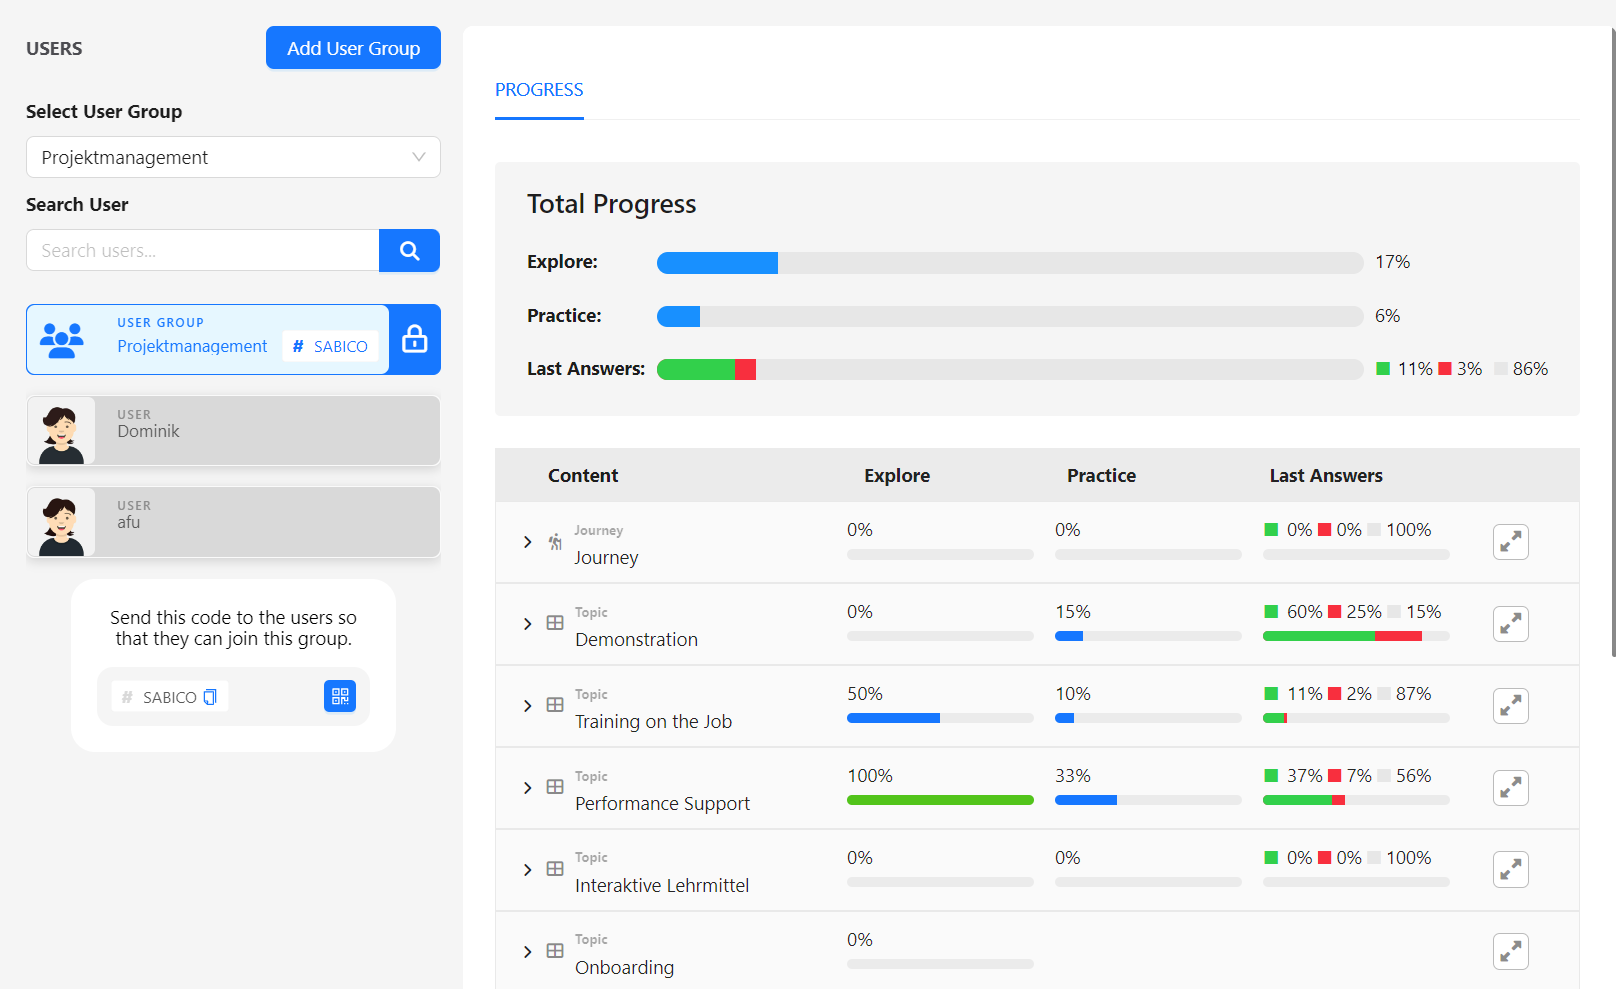
Using the Select User Group checkbox at the top left, you can select the desired group and view the progress of the group and the users in the group.
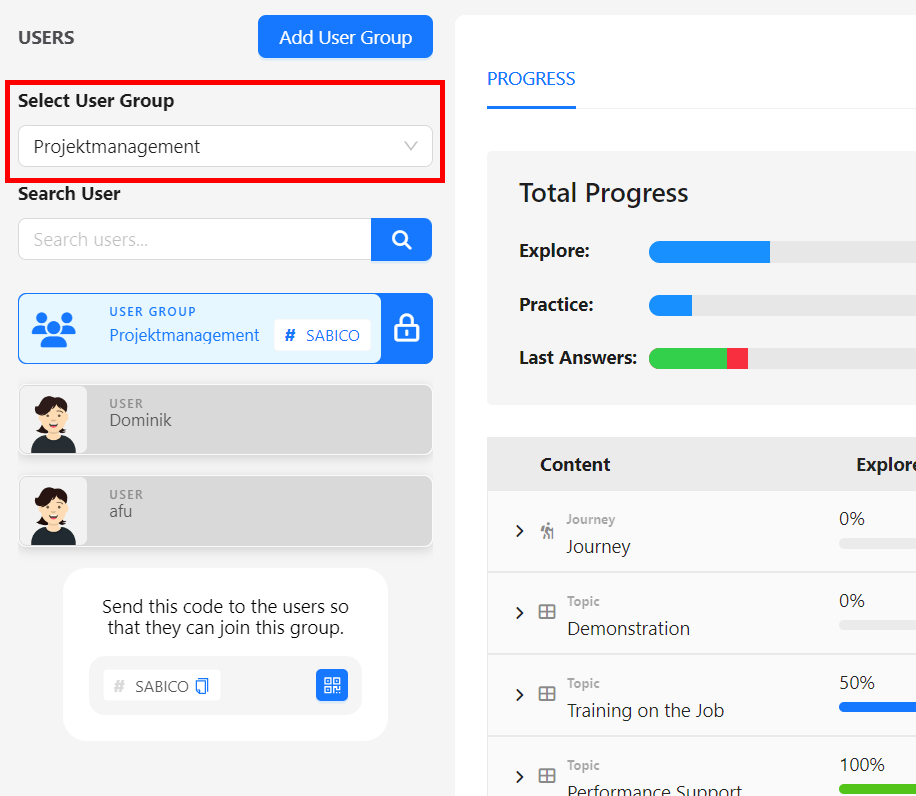
On the left-hand side, you can select the group as a whole to view the progress of all users in the group or select individual users.
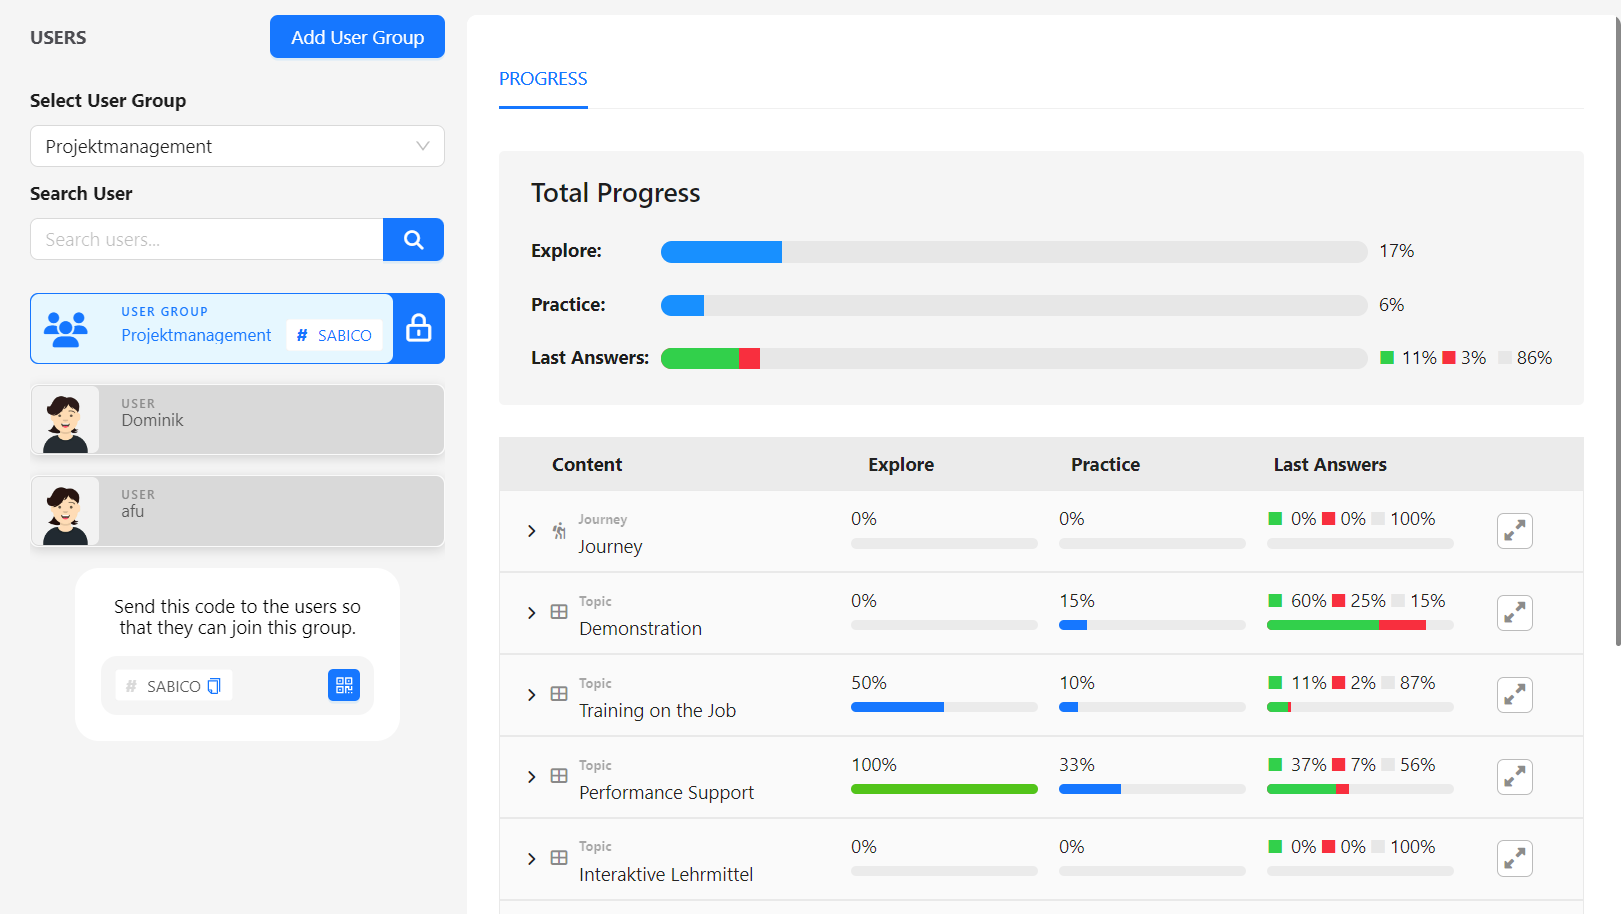
In the picture above, you can see that the group "Project Management" has been selected. This group contains 2 users. On the right-hand side, you can see the overall progress at the top. 17% of all decks have already been discovered by the group and the progress of all practised question cards is 6%. In the last run-through of all available practice questions, 11% were answered correctly, 3% incorrectly and 86% have not yet been answered at all.
Below you can see all the library items that this group is allowed to see. The library items are displayed in their hierarchy. At the beginning, all topics are visible here.
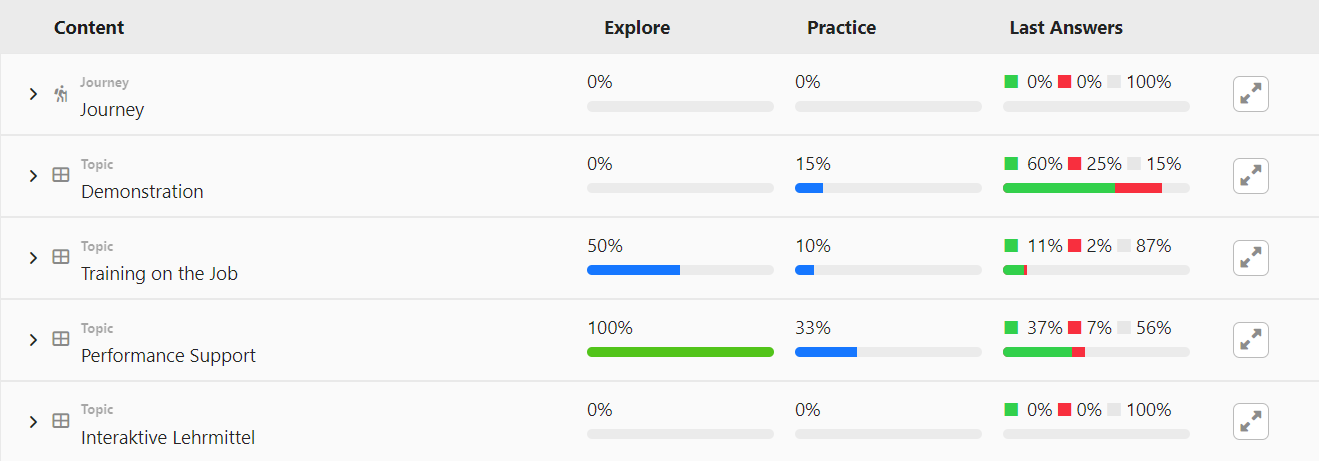
In the progress data, you can see in the image above that 0 out of 2 users have discovered the topic "Demonstration" completely (all included decks). The average progress for this topic is 16%. In the last run-through of the practice questions, 60% were answered correctly, 25% incorrectly and 15% not yet.

The topic "Training on the Job" was fully discovered by 50% of the users in the group, i.e. by one user, and has an average progress of 10%. In the last run, 11% of the exercise questions were answered correctly, 2% incorrectly and 87% not at all.

The topic "Performance Support" was discovered 100% completely, i.e. by both users, with an exercise progress of 33%. In the last run, 36% of the exercise questions were answered correctly, 6% incorrectly and 58% not at all.

The topic "Interactive teaching aids" has not even been started yet. The percentage values are therefore 0%.

If you click on the individual topics, you can unfold them and see the progress data of the individual decks.
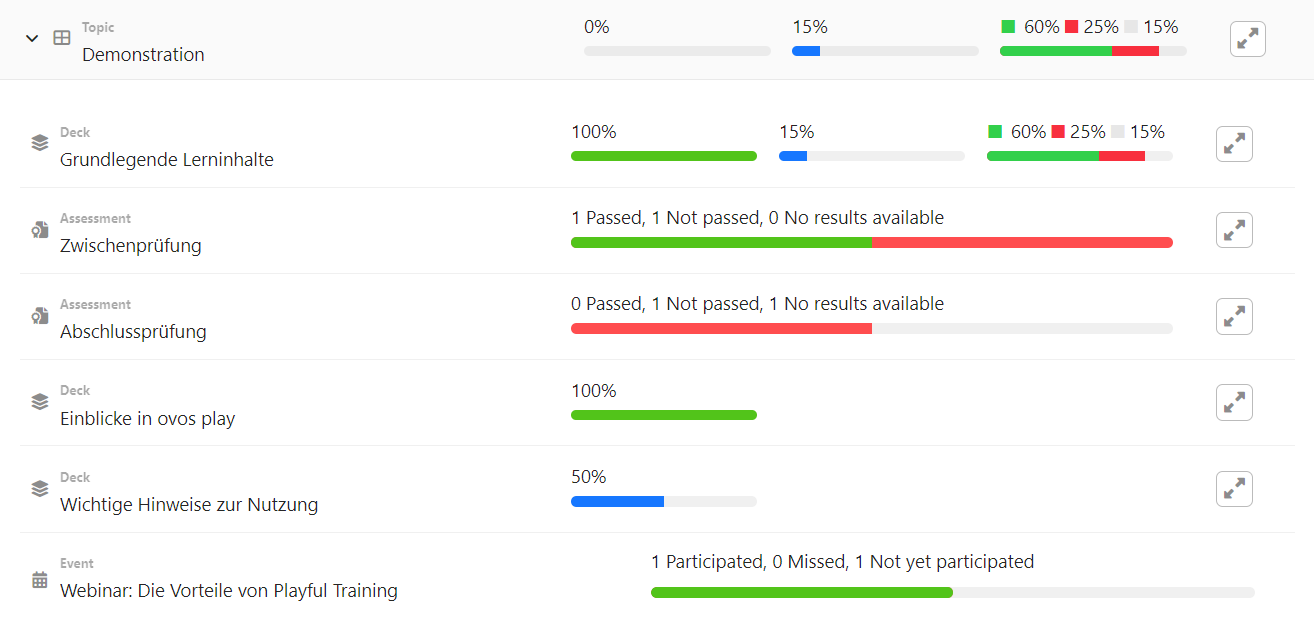
In the image above, you can see that the Demonstration topic is now expanded to show the decks, exams and events within it.
Here you can see that the deck "Basic Learning" has been fully discovered by 100% of the users, i.e. by both users. The average progress of this deck is 16%. In the last run-through of the practice questions, 60% were answered correctly, 25% incorrectly and 15% not yet.

The assessment "Zwischenprüfung" was passed once and failed once. was failed once and not yet started once.

The event "Webinar: Die Vorteile von Playful Training" has been attended once. A user is not yet registered for the webinar.

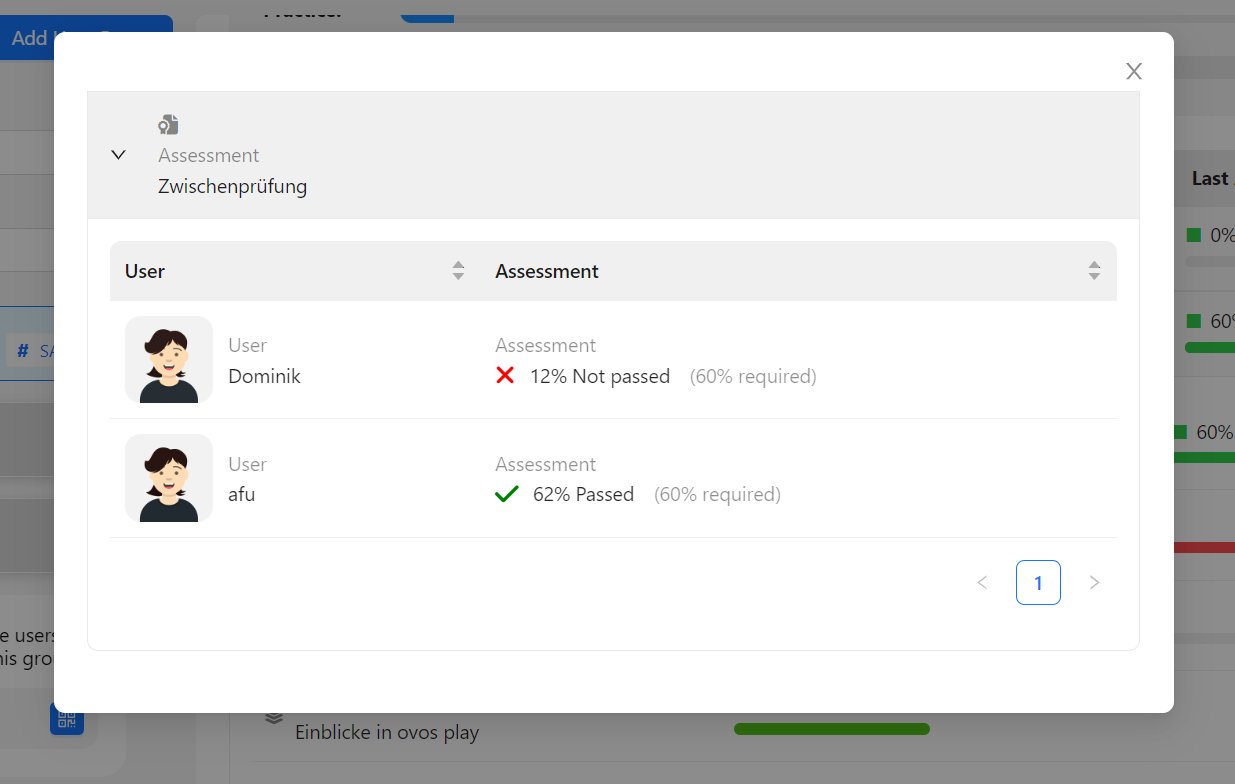
To see which people in the group achieved the results shown, you can use the detail button on the right.

With this button you open a separate window with the detailed results.
If you select an individual user on the left-hand side, you will see the progress data for this person.

In the image above you can see the total progress of the user. 27% of all decks have been fully discovered. The practice progress is 11%. In the last run of the practice questions, 17% were answered correctly, 3% incorrectly and 80% not yet.
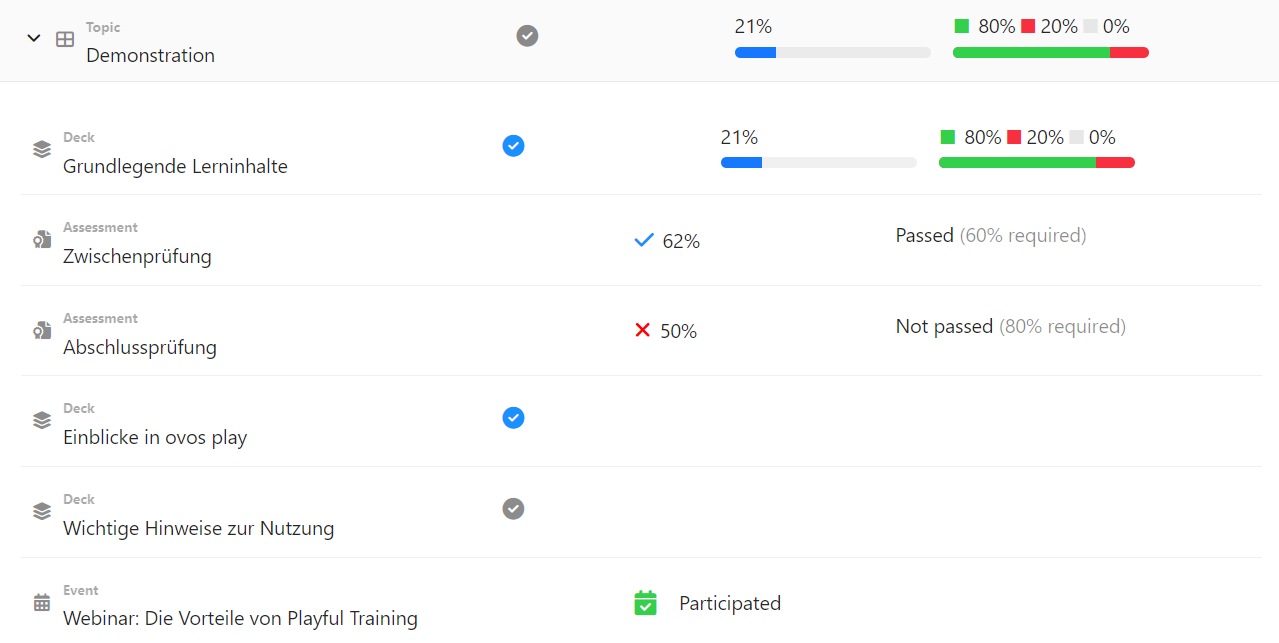
In the "Demonstration" topic you can see that not all decks have been fully discovered yet. The exercise progress is 22%. In the last run-through, all practice questions were answered, 80% of them correctly, 20% incorrectly.
The assessment "Zwischenprüfung" was passed with 62% and the "final exam" was failed with only 50%.
The event "Webinar: Die Vorteile von Playful Training" was successfully attended.