In the Admin Dashboard, you can see the user responses for decks with survey cards. You can also export and analyze survey responses as a .csv file.
To evaluate survey data, first select the deck that contains the survey cards you want to evaluate. Edit the deck by either clicking on the name of the deck in the library or by clicking on the deck in the deck overview under the menu item Decks.
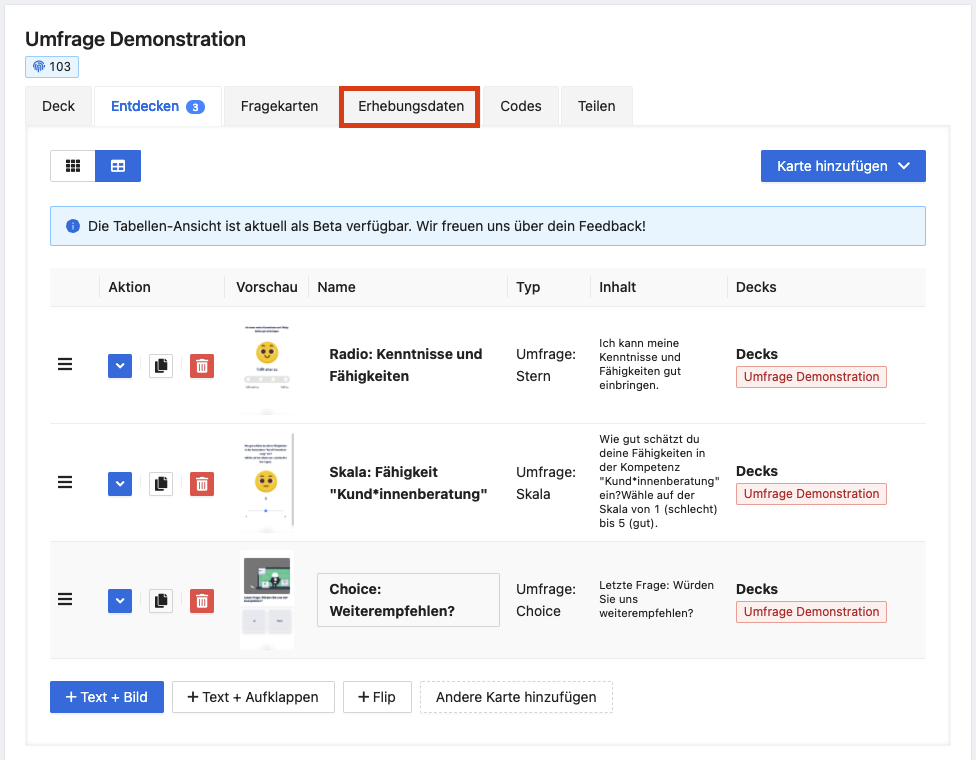
In the deck editor, you will find the Survey data tab. This tab is only displayed if the deck also contains survey cards.

In the Survey data tab, you can see the users' answers directly in the admin dashboard. A table shows which answers a user has given for each survey card.
The user is displayed in each row on the left. Clicking on the nickname takes you to the user editor. The user information is not displayed if your instance is configured to hide user-related data. (If necessary, please get in touch with your ovos contacts).
In each line of the survey result you will see a preview of the map, the map name with link to the map editor and a preview of the map content. On the right-hand side you will find the answers given. You can find out how to evaluate answers correctly in the section Which answer values are used?
Below the list, you can also export the results as a .csv file.
In the survey data, all answers are pseudonymized to ensure an anonymous survey for the users. The same pseudonym is used for each user. This allows you to track responses from individual users.

Example values from survey data
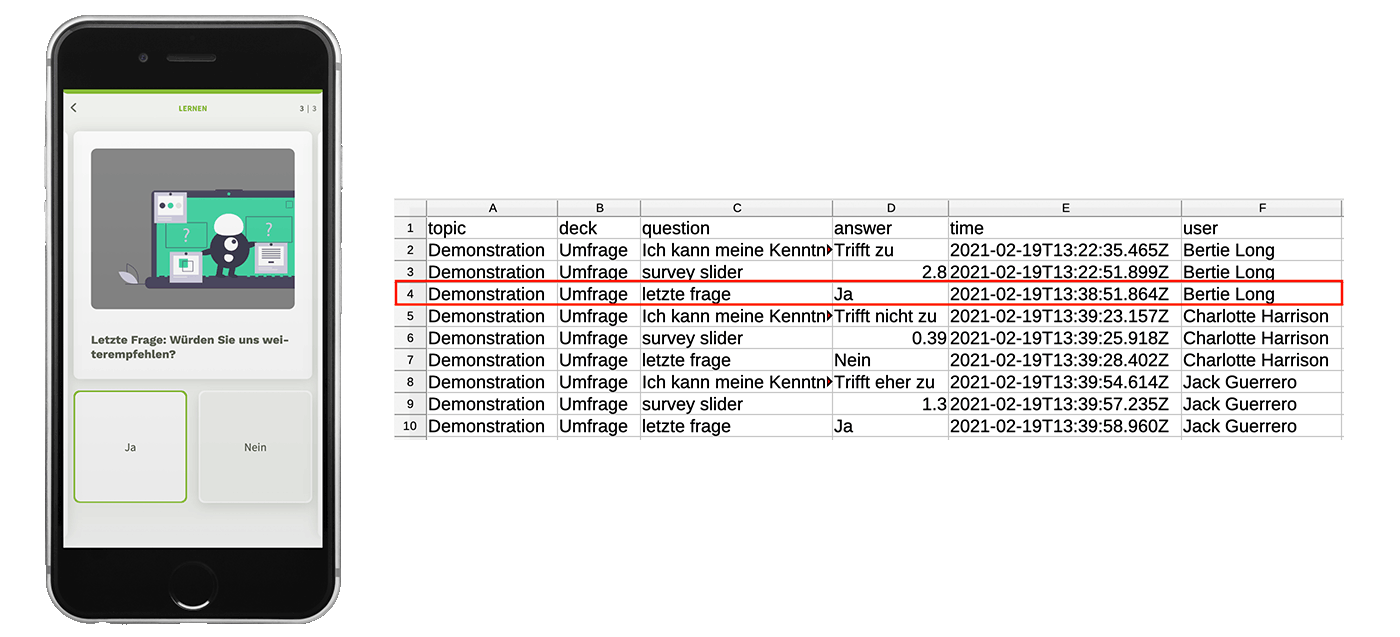
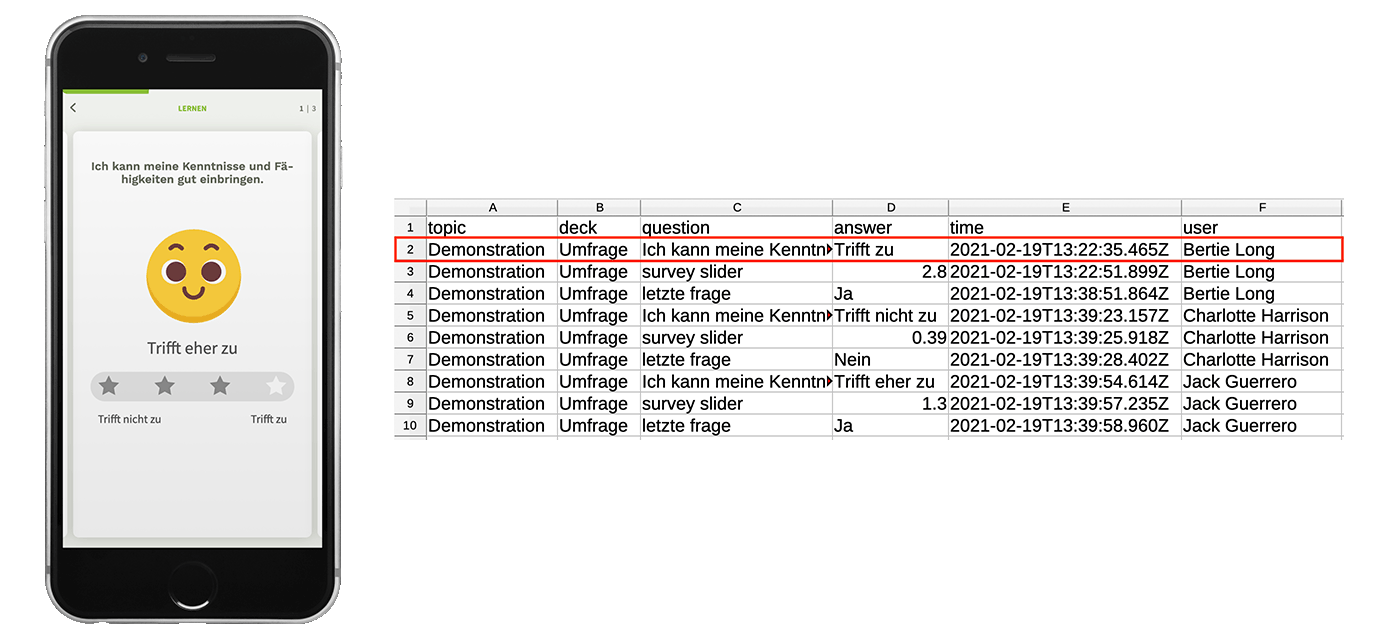
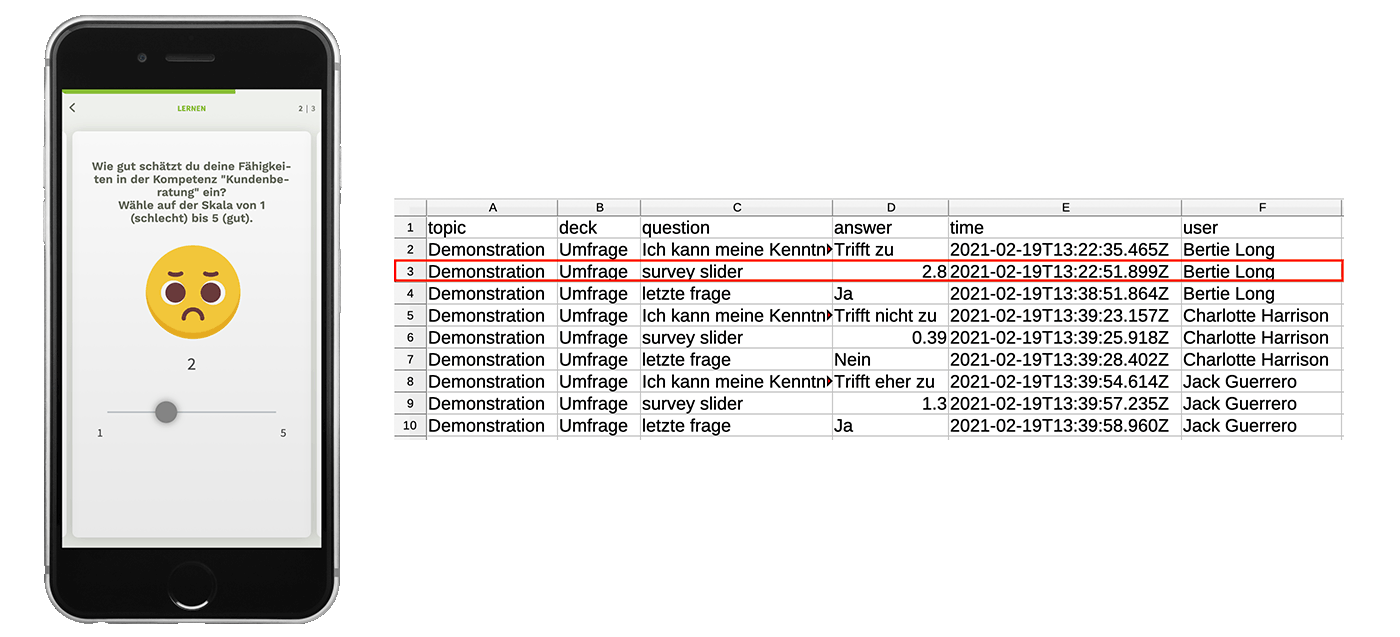
In the example image, you can see survey data from three users who each answered three questions.
Topic: This topic contains the deck from which you downloaded the survey data.
Deck: The survey data comes from the survey cards in this deck.
Question: The name of the survey card is displayed here. Tip: Use comprehensible names for survey cards such as "Survey Scale: Assessment skills from 1-5"
Answer: The selected answer or answer value is displayed here.
Time: The answer was given at this time.
User: Here you will find the pseudonyms of the users who have answered these questions.
Depending on the survey card template, different values are used for the answers. Three templates are available for this purpose: Survey - Choice, Survey - Scale and Survey - Star.
Umfrage - Choice
With the choice template, you can see the answer text of the selected answer in the survey data.

Survey - Radio
You will also see the response text for the selected response in this template.

Survey - Text Entry Box
Here you will see everything the user put into the text entry box.
Survey - Scale
With this template, the response text is not displayed in the survey data. Instead, you receive the numerical values that users enter on the scale. The answers on the scale are divided into tenths.

If you use two answers to the question, the minimum of the scale is 0.0 - the maximum is 1.0. With two answers, you therefore receive a total of 10 different values in the survey data.
From .5, the next highest answer is counted. This means that up to 0.4 users give the first answer, from 0.5 it is the second answer.
If you use five answers for the question, the minimum of the scale is 0.0 - the maximum is 4.0. With five answers, you therefore receive a total of 50 different values in the survey data.
Here too, the next answer is reached at .5. Therefore, values from 0.0 to 0.4 are assigned to the first answer, for answer two therefore 0.5 to 1.4, answer three 1.5 to 2.4, answer four 2.5 to 3.4. For values from 3.5 to 4.0, it is the fifth and therefore last answer option.